Theoretical vs. Actual Bandwidth: PCI Express and Thunderbolt
By Nathan Edwards
Everything you need to know about modern
PCI Express and Thunderbolt's bandwidth potential and limits when
building your next PC.
We are in the future! It is time to continue
our scintillating look at interfaces, and the bandwidth limitations
thereof. This week, we cast our gazes on PCI Express and Thunderbolt.
First, PCI Express: what exactly does it mean when you have a PCIe 2.0
x8 connection? And does it make a difference whether your connection is
x8 or x16?
Photo credit: Flickr user abysal via Creative Commons
PCI Express
PCI Express
is a little confusing. A PCIe connection consists of one or more
data-transmission lanes, connected serially. Each lane consists of two
pairs of wires, one for receiving and one for transmitting. You can have
one, four, eight, or sixteen lanes in a single consumer PCIe
slot--denoted as x1, x4, x8, or x16. Each lane is an independent
connection between the PCI controller and the expansion card, and
bandwidth scales linearly, so an eight-lane connection will have twice
the bandwidth of a four-lane connection. This helps avoid bottlenecks
between, say, the CPU and the graphics card. If you need more bandwidth,
just use more lanes.
There are several different physical
connections, each of which can function electrically as a slot with a
lower number of lanes and can accommodate a physically smaller card as
well. A physical PCIe x16 slot can accommodate a x1, x4, x8, or x16
card, and can run a x16 card at x16, x8, x4, or x1. A PCIe x4 slot can
accommodate a x1 or x4 card but cannot fit a x16 card. And finally,
there are several different versions of the PCIe interface, each with
different bandwidth limitations, and many modern motherboards have PCIe
slots of different physical sizes and also different PCIe generations. Confused yet?
This
Asus Z87-Pro board has two PCIe 3.0 x16 slots (in the green boxes),
four PCIe 2.0 x1 slots (the short gold-colored ones in the short orange
boxes) and one PCIe 2.0 x16 slot that can operate in either x1 or x4
mode (the long orange box).
Let's start with maximum theoretical bandwidth. A single PCIe 1.0 (or 1.1) lane can carry up to 2.5 Gigatransfers per second (GT/s) in each direction simultaneously. For PCIe 2.0, that increases to 5GT/s, and a single PCIe 3.0 lane can carry 8GT/s.
What's with this gigatransfers nonsense? Gigatransfers per second are the same thing (in this case) as gigabits per second, but they include the bits that are lost as a result of interface overhead.
All PCI Express versions lose some of their theoretical maximum
throughput to the physical overhead associated with electronic
transmissions. PCIe 1.* and 2.0 use 8b/10b encoding (like SATA does), the upshot of which is that each 8 bits of data cost 10 bits to transmit, so they lose 20 percent of their theoretical bandwidth to overhead. It's just the cost of doing business.
After
overhead, the maximum per-lane data rate of PCIe 1.0 is eighty percent
of 2.5GT/s. That gives us two gigabits per second, or 250MB/s (remember,
eight bits to a byte). The PCIe interface is bidirectional, so that's
250MB/s in each direction, per lane. PCIe 2.0 doubles the per-lane
throughput to 5GT/s, which gives us 500MB/s of actual data transfer per
lane.
PCIe 3.0 achieves
twice the speed of PCI 2.0, despite having a per-lane throughput that's
only 60 percent more than a PCIe connection.
You've
probably heard that PCIe 3.0 is twice the speed of PCI 2.0, but as we've
seen above, its per-lane theoretical throughput is 8GT/s, which is only
60 percent more than PCIe 2.0's 5GT/s. That's because PCIe 3.0 and
above use a more efficient encoding scheme called 128b/130b
(PDF link), so the overhead is much less--only 1.54 percent. That means
that a single PCIe 3.0 lane, at 8GT/s, can send 985MB/s. That's not quite twice 500MB/s, but it's close enough for marketing purposes.
What
that means is that a PCIe 3.0 x4 connection (3.94GB/s) should have
nearly the same bandwidth as PCIe 1.1 x16, or PCIe 2.0 x8 (both 4GB/s).
Modern
GPUs use a x16 PCIe 2.0 or 3.0 interface. That doesn't mean they always
run at x16 speed, though. Many motherboards have multiple physical x16
slots, but a smaller number of actual of PCIe lanes available. On a Z87 (Haswell) or Z77 (Ivy Bridge) desktop, the CPU has 16 PCIe 3.0 lanes.
Intel chipsets have an additional eight PCIe 2.0 lanes, but those are
typically used for sound cards, RAID cards, and so forth. (AMD's 990FX
chipset includes 32 PCIe 2.0 lanes, plus four on the northbridge.) In
the Asus board shown above, for example, the PCIe 3.0 slots are CPU
lanes, while all the rest have to share the eight chipset PCIe 2.0
lanes. Using the PCIe 2.0 x16 slot in x4 mode disables three of the PCIe
2.0 x1 slots.
Image courtesy Intel
So a single x16 graphics card will use all 16 CPU PCIe lanes, but adding a GPU to the second x16 lane will drop both graphics cards' connections down to eight lanes each. Adding a third GPU will drop the first card's connection to x8, and the second and third cards' connections down to x4 each. This
is why many people who run multi-GPU setups prefer Intel's enthusiast
architectures, like Sandy Bridge-E and the upcoming Ivy Bridge-E. Ivy Bridge-E CPUs will have forty PCIe 3.0 lanes. That's enough to run two cards at x16 and one at x8, one card at x16 and three cards at x8, or one at x16, two at x8, and two more at x4. That's just ridiculous. Does it matter for performance?
Two
PCIe 3.0 GPUs running at x8 each on a PCIe 3.0 motherboard should have
nearly the same bandwidth as two PCIe 2.0 GPUs running at x16--the first
set runs at 7.88GB/s each, while the second two run at 8GB/s. If either
your motherboard or graphics card is limited to a PCIe 2.0 connection,
you'll be stuck using the slower interface.
TechPowerUp did an
enormous roundup of PCIe performance last May. They tested the two most
powerful single-GPU cards at the time--AMD's Radeon HD 7970 and Nvidia's
GeForce GTX 680--at x4, x8, and x16 using PCIe 1.1, 2.0, and 3.0, all
on the same motherboard. This is by far the best apples-to-apples test
I've ever seen on PCIe bandwidth scaling. The entire article is worth a
read, but the performance summary page collects the relative results at a glance.
Last year's most powerful graphics cards perform just fine at PCIe 2.0 x8 or even PCIe 3.0 x4.
As you'd expect, equivalent bandwidth configurations perform around the same. Most importantly, to quote the TechPowerUp authors,
"Our testing confirms that modern graphics cards work just fine at
slower bus speed, yet performance degrades the slower the bus speed is. Everything
down to x16 1.1 and its equivalents (x8 2.0, x4 3.0) provides
sufficient gaming performance even with the latest graphics hardware,
losing only 5% average in worst-case. [emphasis added] Only at even lower speeds we see drastic framerate losses, which would warrant action."
The
most interesting part in these results is the finding that last year's
most powerful graphics cards perform just fine at PCIe 2.0 x8 or even
PCIe 3.0 x4. That means that three-way SLI or CrossFireX should be viable, even in x8/x4/x4, on Ivy Bridge or Haswell desktops. But even if you don't have PCIe 3.0, you're not missing out on much performance running at x8 on a PCIe 2.0 connection.
The
doubled bandwidth of PCIe 3.0 x16, compared to PCIe 2.0, doesn't seem
to make much of a difference yet. AnandTech's Ryan Smith tested two
Nvidia GeForce GTX Titans, the current fastest single-GPU cards, in SLI
on both PCIe 3.0 and 2.0, and found, at best, a seven percent performance improvement at 5760 x 1200.
So
that's good news for people with older motherboards or graphics cards.
Provided you have at least PCI Express 2.0 x8, you're hardly leaving any
performance on the table, even on the fastest cards.
Thunderbolt
Thunderbolt
is a data transfer interface that can pass through both PCI Express and
DisplayPort signals, depending on what it is plugged into. A
Thunderbolt controller consists of two bidirectional data channels, with
each channel containing an input and an output lane. The Thunderbolt
chips on each end of the cable take in both DisplayPort 1.1a and a
four-lane PCIe 2.0 bus. Each channel is independent, and can either
carry DisplayPort or PCIe, but not both. Each direction in each
channel has a theoretical maximum throughput of 10Gbps--the same as two
PCIe 2.0 lanes. As discussed above, due to 8b/10b encoding, 20 percent
of the theoretical limit of PCI Express 2.0 is devoted to signal
overhead, so the maximum theoretical throughput of a single Thunderbolt channel is 1GB/s in each direction.
In first-gen Thunderbolt, that's as fast as you're going to get, since
each device can only access one of the two channels, and you can't
combine them. It's still pretty damn fast, since you can send high-def
video to a DisplayPort monitor at 10Gbps down one channel while reading
1GB/s from an SSD RAID with the other, at the same time.
Image courtesy Intel
So how much performance can you actually wring out of a Thunderbolt connection?
Gordon Ung at Maximum PC saw peak read transfer speeds of 931MB/s when reading from a RAID 0 of four 240GB SandForce SF-2281 SSDs in a Pegasus R4 chassis.
AnandTech actually got an SSD RAID in a Pegasus chassis right up to 1002MB/s
at its very peak, which seems to be right up at the practical limit of a
single Thunderbolt channel, but that was using a RAID 0 of four 128GB
6Gbps SATA SSDs, running sustained 2MB reads at a queue depth of 10. A four-way RAID 0 of SSDs is going to be too fast for a first-gen Thunderbolt connection. A two-drive RAID 0 can approach twice the speed of its individual drives. As we discussed in Part One,
a good 6Gbps SATA SSD can hit 515MB/s. A RAID 0 of two 6Gbps SSDs can
easily saturate the 10Gbps connection available in first-gen
Thunderbolt. A four-way RAID 0 can go far faster, but not while attached
via Thunderbolt. A very brief note on PCIe SSD performance (compared to Thunderbolt)
Despite the limitations of first-gen Thunderbolt, it's still a far better external storage interface than USB 3.0.
The OCZ RevoDrive 3 x2, a PCIe-attached SSD, can hit 1.5GB/s peak
in some sequential read tests on a PCIe 2.0 x4 connection. That drive
uses a SAS-to-PCIe controller, rather than a SATA controller to a RAID
card to a PCIe connection, but surely that can't explain the entire
speed difference. After all, Thunderbolt is a PCIe 2.0 x4 connection
too, right? Sort of. Each Thunderbolt storage drive is limited to one
channel with a maximum bandwidth of 1GB/s. The RevoDrive 3 x2 can use
the entire PCIe x4 connection, with its peak (post-overhead) bandwidth
of nearly 2GB/s. The Next Thunderbolt
The next
version of Thunderbolt, cleverly named Thunderbolt 2, will let you
combine both channels into one, with a theoretical maximum of 20Gbps
(2GB/s, post-encoding), allowing devices to take advantage all four PCIe
2.0 lanes in the Thunderbolt connection. It also brings increased
bandwidth to the display side of things; you'll be able to stream 4K
video to that fancy 4K monitor you've got lying around. So far
Thunderbolt 2 is only available on a couple of motherboards from Asus but it'll ship on the new Mac Pro as well, if and when that beautiful, weird-ass cylinder ever emerges from One Infinite Loop.
Despite the limitations of first-gen Thunderbolt, it's still a far better external storage interface than USB 3.0, which at best is only half the speed of a first-gen Thunderbolt connection (5Gbps maximum) and in real life, as we saw last time, doesn't hit anywhere close to its maximum theoretical throughput.
Back in February both James and I attended a press event
in London held by Kingston. This event was held to announce that
Kingston and HyperX were no longer focusing on the same market and that
HyperX would be solely aimed at Gamers (about time too 😉 ). It also gave us our first look at the awesome HyperX Cloud Headset
and a replacement for the highly successful HyperX Blu range, the brand
new HyperX Fury. The range is available in single or dual channel
kits, available in 4GB, 8GB or 16GB; 1333MHz, 1600MHz or 1866MHz and in
blue, black, white and red. So quite an impressive line-up. HyperX
have sent us a HyperX Fury 8GB 1866MHz (HX318C10FRK2/8) to try out. Rather nicely the entire range has a black PCB and our ssample is red to match our Test Rig. So fingers crossed they perform as good as they look.
Get in the game with HyperX® FURY!
‘Even newbies get up to speed fast, since FURY automatically recognises
its host platform and automatically overclocks to the highest frequency
published – up to 1866MHz – providing plenty of power for your next
deathmatch. FURY’s asymmetric heat spreader design lets you stand out
from the “square” crowd. It’s available in black, blue, red and– for
the first time in the HyperX line –white, with a black PCB. So your rig
can reflect your style and you can show it off with pride – without
spending a lot, since FURY is affordably priced. It’s 100 per cent
tested and LAN-ready, plus it’s backed by a lifetime
warranty and free technical support.’
The HyperX Fury kit arrived in a typical clear plastic wallet, sealed
with a Kingston branded sticker (Despite now being HyperX). Usually
the part number (for this kit HX318C10FRK2/8) would tell you the
specifications (check out this link), but if going by this code the memory MHz would be 3100? Or perhaps HyperX are doing things a little differently…
The packaging is held together by the same specifications sticker, so
to get to the Fury inside a delicate operation is required (a little
brute force and some tearing, it’s a very sticky sticker!).
Once out of the wallet and no longer obscured by the labelling, we can easily see how good the HyperX Fury looks.
Also included inside the plastic wallet is a warranty &
installation guide. This small leaflet outlines the Kingston Lifetime
Warranty and shows a simple guide of how to install memory.
At the time of writing the HyperX Fury 8GB 1866MHz Memory kit is retailing for approximately £60.29 on Amazon or Overclockers UK for £64.99 and comes with a Lifetime Warranty.
Undeniably the metallic red HyperX Fury, with its black PCB look good
from any angle, in fact I’d even go as far to say perhaps the best
looking ram sticks I’ve come across (of course once installed, you’ll
only see the edge!).
The HyperX Fury features a newly designed heat-spreader, which unlike
most isn’t symmetrical. The front of the heat-spreader has the new
model name printed in white on the left, whilst on the right the HyperX
brand logo is moulded on with a textured finish.
The back of the Fury is more or less the same, except instead of the
model and branding, there’s a warranty and model details sticker.
From the top (the bit you’ll see when installed), we get to see the
asymmetrical heat-spreader with the HyperX brand name to the far right.
Looking at the connection side of the Fury allows us to see the all black PCB and the textured detailing of the HyperX logo.
Something else that is clearly noticeable is the height of the
heat-spreader. Whilst not classed as low-profile RAM, the HyperX Fury
heat-spreader is not much higher than the PCB itself, this should mean
that regardless of your CPU cooler, it should fit easily without any
compatibility issues.
Hardware Installation
Installation of the HyperX Fury 1866MHz 8Gb DDR3 Kit into our Test Rig was simple enough. The RAM sticks aren’t tall enough to cause any compatibility issues with our test cooler the Raijintek Themis, which should mean no issues with other coolers either.
The Test Rig booted first time and with the MSI Z87 G45
motherboard left on Auto settings the HyperX Fury DDR3 automatically
set its frequency to 1866MHz, with timings of 10-10-10-28 at 1.5 volts.
Impressive as there’s no eXtreme Memory Profile (XMP) setting for the
Fury, it just works!
However with a little playing around with the timings using Intel XTU,
the HyperX Fury can easily be overclocked from 1866MHz to not only
2133MHz, but 2400MHz as well! Which for a set of sticks rated at
1866MHz and with an SRRP of £60 is pretty stunning. See AIDA64
Benchmark Results below for full details of timings etc.
Testing Methodology/Setup
The HyperX Fury 8GB 1866MHz RAM Kit was tested as part of our normal Test Rig, using Windows 7 64Bit (Service Pack 1) with all relevant Drivers installed. Prime95 (Blend) was used to test stability, whilst Intel XTU for overclocking and the following benchmarks were also used.
Avexir Blitz 1.1 Original 8GB 2400MHz @ 10-12-12-31
34247
35303
31127
46.7 ns
HyperX Fury 8GB 1866MHz @ 10-10-10-28
26870
27494
24500
55.8 ns
Avexir Core 8GB 1600MHz @ 9-9-9-24
23134
23751
21781
58.9 ns
The image above from AIDA64 shows that the throughput and the latency
of the HyperX Fury 8GB 1866MHz memory is more or less in the correct
range for its price range, which is good. The real magic in the Fury
modules is when you overclock them.
AIDA64 Benchmark Results (Overclocking Results)
Memory
Read
Write
Copy
Latency
HyperX Fury 8GB 2400MHz @ 13-15-13-39
33282
34812
29518
53.4 ns
HyperX Fury 8GB 2133MHz @ 12-13-12-35
30325
31169
27566
55.1 ns
HyperX Fury 8GB 1866MHz @ 10-10-10-28
26870
27494
24500
55.8 ns
After adjusting the HyperX Fury timings (as seen above), you can get a
huge performance gain. Admittedly the timings are a lot looser than
I’d have liked, but the figures speak for themselves.
Gaming Related Benchmarks
To give us some idea of the effect the increase in memory speed has
on Gaming, the benchmarks below have been run at 1866MHz, 2133MHz and
2400MHz using the HyperX Fury modules. We actually changed the
benchmarks a little in an attempt to look a little deeper into the topic
of whether an increase in Memory speed does truly affect FPS to any
real degree. Let’s see shall we…
As you can see faster memory does make a small difference within the
FireStrike test, but for all else it’s not far off the same. The reason
for this? Perhaps the timings are too slack on the overclocks to give
any real benefit or perhaps the advantage of high speed memory (in terms
of Gaming performance) is somewhat pointless! 😉
Final Thoughts
The HyperX Fury 8GB 1866MHz
RAM kit is a great start for the HyperX range. They arrived solidly
packed in a clear plastic wallet. Look good in the wallet, but in hand
feel well made and look even better.
With a wide choice of colours available (red, blue, black or white),
means they will suit any rig out there, whilst the low height of the
heat-spreader means you’ll be unlikely to have any compatibility issues
with even the biggest CPU cooler!
The HyperX Fury 8GB 1866MHz perform well at their native speed, but
slacken those timings and the RAM happily runs at 2400MHz (with a little
help from Intel XTU)
without even having to change the voltag! Of course even at this speed
it doesn’t perform quite as well as dedicated 2400MHz rated RAM
modules, but the fact it comes close is amazing!
I’ll admit I like the HyperX Fury, they look good, offer good
performance and at approximately £60 are priced well, but what really
gets me excited about them isn’t even the product itself! It’s the
promise of the now flying solo HyperX brand giving us an even better
product in the guise of a new Genesis or Predator range!
Motherboard BIOS and
Windows® based memory testing tools report that the installed DDR3
memory is running at a lower speed than expected.
In the
following guide, we will discuss what determines your systems standard
memory speed and how to explore what the maximum speed of each memory
component is. Memory speed overview
By default, your
computer system will use the safest speed settings that it can
automatically detect from within the memory components. This speed will
be limited by your slowest component. Please note that some Windows
based tools will report your memory speed to be half of the speed in a
DDR memory configuration, e.g. Tool reports memory speed of 667MHz which
equates to a DDR memory speed of 1333MHz. The memory components consist of
The memory controller is integrated into the AMD processor.
The maximum speed supported varies by processor family and is also
limited by the amount of memory slots used.
Depending
on your selected motherboard and memory, the published speeds and
configurations above may be exceeded, which will result in running your
AMD processor outside of AMD published specifications.
See note. For details, please see the guidance below and contact your motherboard manufacture or memory supplier.
Back to top
When installing modules of memory of differing speed
grades or brand, the memory will always run at the speed of the slowest
module installed.
Some memory modules have two speed grades, a
tested maximum speed and a standard speed. In automatic selection mode,
the standard speed will always be used.
The amount of populated memory slots can affect the achievable final memory running speed.
Memory design in Single or Dual rank can effect memory speed
Most memory should be clearly identified if it is dual rank memory and if not identified, it is usually single rank memory.
Dual
rank memory will run slower than a Single Rank memory of equal quality,
as it requires an extra step when addressing memory locations.
Identifying your memory modules and their specifications
Check the labels on the memory to identify the make and model number of your memory -
The
two pictures above show a single piece of memory, this is also referred
to as a DIMM (Dual Inline Memory Module) and the second picture shows a
close up of the memory DIMM label.
The label shows details such
as the memory manufacturer and the part number which usually
incorporates some of the memory specifications. On our example here, the
memory part number is KHX2133C9AD3X2K2/4GX.
Once you have the
memory part number, you can download specifications from the memory
manufactures website. In the description of our example memory we can
see that this memory has a tested and published speed of 2133. The
standard speed which the BIOS will detect from reading the memory module
is 1333. In the example below, the Serial Presence Detect (SPD)
programmed speed is 1333.
In
automatic selection mode the BIOS would therefore run our example
memory at 1333. In order to achieve the tested speed of 2133, you would
need to manually adjust the memory speed settings. However, this will
also need to be supported by the motherboard.
Motherboard & BIOS
Motherboard
manufactures determine their own limitations for their motherboard
design which may exceed the AMD memory controller specifications. These
will require manual set-up. The required settings and limitations are
usually published in the form of a Qualified Vendor List (QVL), and are
available from the motherboard manufacturer website. If the settings
and limitations are not published, contact the motherboard
manufacturer directly.
How to determine the maximum achievable memory speed based on the motherboard manufactures published Qualified Vendor List.
In
order to achieve your memory modules rated speed, you will have to
ensure they are included on the motherboard QVL list. The QVL should
detail the required timing, voltage and maximum amount of supported
modules for the desired speed.
Example QVL list below for 1866 speed memory on an Asus Crosshair V Formula motherboard
If
we take the OCZ3G1866LV4GK as an example, we will need to set the
memory timings to 10-10-10 and the memory voltage to 1.65 and we will be
limited to a maximum of 2 x modules e.g. 8GB. Using more modules may
require us to reduce the speed.
If data is missing or the details
provide by the motherboard manufactures do not contain voltage, timing
settings and number of memory slots supported, you will have to contact
the motherboard manufacturer for more details. Please Note: AMD processors are intended to be
operated only within their associated specifications and factory
settings. Operating your AMD processor outside of specification or in
excess of factory settings, including but not limited to overclocking,
may damage your processor and/or lead to other problems, including but
not limited to, damage to your system components (including your
motherboard and components thereon (e.g. memory)), system instabilities
(e.g. data loss and corrupted images), shortened processor, system
component and/or system life, and in extreme cases, total system
failure. AMD does not provide support or service for issues or damages
related to use of an AMD processor outside of processor specifications
or in excess of factory settings. You may also not receive support or
service from your system manufacturer.
DAMAGES CAUSED BY USE
OF YOUR AMD PROCESSOR OUTSIDE OF SPECIFICATION OR IN EXCESS OF FACTORY
SETTINGS ARE NOT COVERED UNDER YOUR AMD PRODUCT WARRANTY AND MAY NOT BE
COVERED BY YOUR SYSTEM MANUFACTURER’S WARRANTY.
http://support.amd.com/en-us/kb-articles/Pages/ddr3memoryfrequencyguide.aspx
If
you are in the process of deciding for a particular notebook HDD you
will have noticed that the variety of models is in the way of making a
quick selection. Criteria like amount of storage space, speed of data
transfer, purchase price or the height of the HDD are joined by the
feature of hybrid (sshd) drives. To get a good overview of the current
market situation, we compared a total of 14 2.5" test
subjects in different variants. Among them are various models of the big
four manufacturers (HGST, Seagate, Toshiba and Western Digital). The
storage space ranges from 500 gigabytes to 2 terabytes, with HDDs' and
SSHDs' heights varying from slim 7 to massive 15 mm. The following pages
will feature technical details and of course a performance check.
Back when we tested the 3.5" models, we focussed on storage space as a
listing criterium; this approach seemed unsuitable for the notebook
segment. The amount of storage space offered is only a minor criterion.
Rather, we focussed on classification by noise level, power consumption
and heat generation. We have deliberately created a large which compares
all subjects, notwithstanding that some comparisons can be a bad fit,
or that the manufacturers intended them for different operating
scenarios.
On the following pages, each of the drives will be presented with its
features and characteristics. We will be anticipating benchmarks with a
short statement on the performance.
The beginning of the roundup makes
the HTS541515A9E630 from the series "Travelstar 5K1500" by HGST. It
features a capacity of 1.5 Terabytes in the traditional 2.5" format at
9.5mm height. Inside we find three magnetic disks that rotate at 5400
revolutions per minute. Traditionally, HGST publish their mobile hard drives in the "Travel Star" series, with the name already mentioning rotation speed (5K/7K) and capacity.
{jphoto image=46195}
The transfer interface is as usual SATA 6Gb/s, the drive has a cache
of 32 megabytes. In addition to the above "standard type" there are two
further models: one with Bulk Data Encryption and onc with "Enhanced
Matte" certification (= 24x7). The physical sector size is 4096 bytes
(4K), but is on emulated by the controller to be 512 (512e). The
HTS541515A9E630 comprises a three-year warranty.
The performance of the Travelstar is at a level comparable with the
MQ01ABB200 drive from Toshiba and the Western Digital WD20NPVT. The
5K1500 is very apt at running the PCMark benchmarks, but then looses
compared to the MQ01ABB200 in terms of the data transfer rate and access
time.
Another represantative of HGSTs Travelstar series is the 7K1000,
represented here by the HTS721010A9E630. As the name suggests, it's a
specimen with a capacity of one terabyte. The HDD has two magnetic disks
operating at a rotational speed of 7200 rpm. For the notebook sector,
the faster rotating models are more likely to be exotic, as their
increased performance will lead to higher power consumption and noise.
The internal cache is 32 MB. No differences regarding speed of the SATA
interface and the physical/emulated sector size. Buyers of
HTS721010A9E630 receive a three-year warranty.
{jphoto image=46196}
Thanks to the high rotational speed of the HTS721010A9E630, it is
able to secure first place in the Random Access benchmark. In the
sequential read and write rates makes for a head-to-head race with the
WD7500BPKX. In the other benchmarks, the two 7200-rpm drives are quite
similar. Thanks to lower values in power consumption, temperature, and
noise, the HGSTs 7K1000 is somwhat ahead.
The third tes subject by HGST is
the HTS725050A7E630 from the extra-thin Z-series Z7K500. Models of this
series have normal dimensions in length and width, but a reduced height
of only 7 mm. Also worth mentioning is the fact that the 500 GB of
storage are provided by a single disc. Combined with the rotation speed
of 7200 rpm, this HDD is therefore likely to belong to the higher
performing models.
{jphoto image=46197}
The SATA interface is as usual 6Gb/s, the drive's internal cache
amounts to 32 MB. HTS725050A7E630 uses 4k sectors internally that are
automatically emulated as 512. As with the normal Travelstar series,
there are additional models with Bulk Data Encryption and Enhanced
Availability. The warranty period for HTS725050A7E630 is two years.
Contrary to our expectations, the Z7K500 is only minimally above the
performance levels of the remaining 5400 rpm HDDs. But it is
significantly slower than the 7200 rpm drives. Although it is meant for
mobile purposes (e.g. ultra-thin external disk), we would have expected
more from the Z7K500 due to the 1 disc design and high rotation speed.
From Seagate's new "Laptop SSHD"
series we received the ST1000LM014. The acronym SSHD was formerly known
as hybrid drives HDDs with additional flash memory. In the past, Seagate
offered their Momentus XT, which we added to this comparison (more on
this later). The aim of this
SSHD synthesis is to unite the best of both worlds: a high capacity by
magnetic writing and the fast access times of an SSD.
The core of Seagate SSHD is the "Adaptive Memory Technology". It is
an algorithm that analyzes the data usage and frequently used
information stored on the SSD area. A similar method has been applied in
the Momentus XT; however, it was only possible to use the flash memory
when reading. The new laptop and laptop thin SSHDs can now write
directly on the NAND area. An unusual feature is the large DRAM cache of
the ST1000ML014, which amounts to 64 MB. The SSHD has a capacity of one
terabyte, provided by two disks. In addition, an SSD area was
implemented based on MLC chips with a total capacity of 8 GB. The
rotational speed of the magnetic disks is 5400 rpm, using 4k sectors.
Seagate grants a warranty period of three years.
{jphoto image=46198}
The promised SSD-like performance of the ST1000LM014: the Random
Access Time was 19.8 ms in the first run, in subsequent tests it went
down to 0.3 ms. Similar jumps were also measurable in PCMark Vantage,
from 5866 points in the first run to 14825 points in the second and
eventually up to 17318 points in the third round. PCMark 7 however is
unruly against SSHDs, no significant increase was seen between the
individual runs.
With the ST500LM000 we present the
second Seagate test subject, this time from the series "Thin Laptop
SSHD". As the naming suggests, it is a very flat model. The height of
the series has been reduced to 7 mm, the capacity was also reduced: to
500 GB. Only one magnetic disk is used, which leads to less heat and
noise. The flash area is identical in size: 8 GB, provided by MLC chips.
In terms of technical equipment, there are no differences between laptop and laptop thin versions, and we do not need to repeat the data. As with the laptop SSHD, Seagate grants a 3 year warranty.
{jphoto image=46199}
Comparing ST1000LM014 and ST500LM000 in their benchmark results, most
of the results are in favor of the ST1000LM014. It must be said however
that the differences are really marginal. Only during the boot process
there was a distinct advantage of the ST1000LM014 by almost six seconds,
but the ST500LM000 was better by almost seven MB/s at the minimum read
rate. Although the ST500LM000 has one magnetic disk less, the reduced
height provides for increased heating, it gets 2°C warmer than the
ST1000LM014.
The third Seagate representative is
the former SSHD Momentus XT series. Drives of this series have already
been available for some time, but for completeness' sake we decided to
go for the ST750LX003. Contrary to the new generation of SSHDs, the Momentus XT is
still operating with 8GB SLC chips and the disks rotate at 7200 rpm.
The recognition of which data goes into the flash area is completely
automated and runs in the background, no driver or user intervention
required. The capacity of 750 GB is provided by the ST750LX003 on two
disks. The internal buffer amounts to 32 MB. Seagate grants a warranty
period of 3 years, and the drive has reliability values (Load / Unload
cycles of 600,000, non-recoverable read error rate of 1 per 10 ^ 14
bits) known from desktop HDDs.
{jphoto image=46200}
A direct performance comparison of the Momentus XT drives with the
successor of the new laptop SSHD series shows that Seagate has made
significant improvements in the Adaptive Memory process (recognition
algorithm for performance control). Between first and second run of
PCMark Vantage, the Momentus XT only showed an increase of about 3700
points, whereas the two new laptop SSHDs achieved 9000 points more. In
the Overall and Secondary Storage Evaluation of PCMark 7, the Momentus
was able to gain a narrow lead.
Now that we have looked at the
subjects from HGST and Seagate, we come to the third manufacturer:
Toshiba. The PR agency provided us three drives in varying versions, and
we will start with the MQ01ABB200. The mobile 2.5" disk has a capacity
of 2 terabytes, which of course is reflected in the increased height.
Instead of the 9-mm standard format, the MQ01ABB200 is a whopping 15 mm
high. Four magnetic disks rotate at 5400 revolutions per minute. It is
amazing that the HDD has a comparatively tiny cache of only 8 megabytes.
This is for us the first indication that the drive is designed almost
exclusively for use in external data sources, where sequential
read/write is more important and a bigger cache is not that crucial. The
SATA interface 3Gb/s is also not quite up-to-date. The MQ01ABB200 has a
special feature: a shock sensor. Factory Toshiba offers a warranty
period of two years.
{jphoto image=46203}
The lower rotational speed of the MQ01ABB200 is reflected in the
measured Random Access Time: 17 to 18 ms. No quantum jumps were to be
expected concerning the transfer rate: 56 to 91.6 MB/s (read) and 54 to
88 MB/s (write). This places the drive in the midfield, just like in the
PCMark Suites. The results match the design, the focus is clearly on
capacity and not on performance. As a data dump the MQ01ABB200 is an
outstanding device, as a system drive or storage location for game files
it is unsuitable.
The next model from Toshiba is the
MQ01ABF050 from the MQ01ABFxxx series. Equipped with one disc, the HDD
provides the buyer with a storage capacity of 500 GB. The rotation speed
of 5400 revolutions per minute will not lead to quantum leaps in terms of performance, the
cache of 8 megabytes is somewhat small. In line with the low capacity
and the use of one disc, Toshiba was able to limit the height of the
MQ01ABF050 to 7 mm. The physical sector size is 4K, which can be
emulated as 512 bytes. The SATA interface operates at state-of-the-art 6
Gbit/s. The warranty period is two years.
{jphoto image=46201}
The MQ01ABF050 is a solid drive, which delivers an average
performance considering the technical data. The results are in the lower
midfield, often only just behind the competition. In PCMark 7 and
Vantage it occupied the last place, while it fared slightly better in
the HDTune tests. With its low height, the HDD is suitable mainly for
very flat external drives or ultra-compact sub/netbooks.
The third drive from Toshiba is the
MQ01ABF050H from the MQ01ABFxxxH series. The capacity amounts to 500 GB
(on a single magnetic disk), 8 GB of NAND Flash used by the SSHD
automatically for fast data retrieval. Since only one magnetic disk is
used, the Toshiba was easily able to reduce the overall height to 7 mm.
The rotation speed is moderate 5400 rpm and the cache amounts to 32 MB.
The interface is SATA (6Gb/s). The warranty period of the MQ01ABF050H is three years, as for all * ABFH models.
{jphoto image=46202}
In the individual test disciplines, the MQ01ABF050H showed good
results. It remains to note that the quality of the detection algorithms
for flash use varies significantly from manufacturer to manufacturer:
while the two Seagate SSHDs in Vantage first run were able to score
significantly more points (Seagate: 5866/5657, Toshiba: 3397), the
second run went to Seagate, too (Seagate: 14825/14494, Toshiba: 8715).
However, after the third round, all three subjects were almost on a
level (Seagate: 17318/17295, Toshiba: 17877). Concerning the IOPS in
HDTune, the MQ01ABF050H was clearly ahead, just like in the total value
and individual events in PCMark 7.
Western Digital also provided us
with a few notebook hard drives. Let's start with the
performance-oriented WD7500BPKX from the Black series of the
manufacturer. Our model has been equipped with the fastest SATA
interface with 6 Gbit/s, older specimens with the BPKT name only provide
3 Gb/s. The rotation speed of the two magnetic disks in all HDDs of the
Black Series is 7200 rpm, the cache at 16 MB is rather meager. Western
Digital grants purchasers a very long warranty period of five years.
{jphoto image=46204}
The performance promises from Western Digital were easily met by the
WD7500BPKX; in benchmarks it is clearly ahead of the rest of the drives
(with the exception of the SSHD) and has to share top ranking only in a
few benchmarks with HGST's Travelstar. However, it is also the leader in
power consumption (under load), and in noise level: during the
benchmark runs, a significantly perceptible operating noise was
consistently audible. However, the temperature remained stable at a low
level, other drives got much warmer.
The second WD drive is the
WD10JPVX, the first representative of the Blue Series. Analogous to the
Black model there are various versions that provide information about
the used SATA Interface: the CX/VX-identifiers have 6 Gbit/s, the
VT-versions only 3 Gb/s. The cache of all specimens amounts to 8 MB,
except for the WD10SPCX and the WD7500LPCX, which have 16 MB. The
rotational speed of the drives the same in all versions, 5400
revolutions per minute. Western Digital grants a two-year guarantee for
models of the Blue series.
{jphoto image=46205}
The WD10JPVX is an all-rounder that does not excel in any discipline.
The results are average, no positive or negative accents. This is a
good HDD for various applications at a fair price, no more and no less.
However, the low cache makes it ideal for use in external enclosures,
since as soon as many data requests go to the HDD, it will be full, and
performance will definately suffer.
The second representative of the
Blue Series is the WD10SPCX. This is the "thin" version, the height is
only 7 mm. There is also the "Ultra Thin" version WD5000MPCK with 5 mm,
which features a SFF-8784 connector Edge and is not intended for the end
user. Despite the reduced height, our WD10SPCX provides a
capacity of one terabyte in two disks. Rotation speed is 5400 rpm and
cache amounts to 16 MB. Regarding the performance of the WD10SPCX, is is
therefore likely to be end up in the midfield.
{jphoto image=46207}
Our performance comparison confirms the assumption that this is a
solid 2.5'' drive. In all disciplines, the HDD delivers average results
that do not stand out, neither positively or negatively. It can easily
be used in notebooks, consumption and noise measurements did not show
negative results, and with the 16-MB cache it will easily be able to
cope with everyday use.
The fourth WD drive we received is
WD20NPVT of the capacity-oriented Green series. In its massive height of
15 mm, Western Digital implemented 4 drives, the buyer gets two
terabytes of disk space. With this design, the WD20NPVT of course will
not fit into notebooks, but considering the primary purpose of use in
external data sources, this is quite irrelevant. The NPVT is equipped
with SATA 3 Gb/s, the slightly larger brother NPVX has SATA 6 Gbit/s.
With a cache size of only 8 MB, it is becoming increasingly clear that
WD did not have a high performance in mind. The rotation speed amounts
to 5400 rpm and the warranty period to two years.
{jphoto image=46210}
Looking at the all-benchmarks, the WD20NPVT has a performance which
places it at the bottom of the ranking. In the sequential transfer tests
under HDTune, it was able to show better transfer rates, which confirms
its destination as a data dump. Anyone looking for an average 2.5"
drive with this high capacity has come to the right place. It is more
expensive than the Toshiba MQ01ABB200, though.
The fifth WD drive, and at the same
time last test subject for this roundup, is from the brand new Red
series, which WD have now extended to include 2.5" drives. The Red is
not available in capacities of 750 GB and 1000, we got the 1 TB version
WD10JFCX. Exactly like the bigger brothers and sisters of the 3.5"
segment, the notebook versions are equipped with WD's NASware 2.0. The
cache is 16 MB and the two disks inside the drives rotate at 5400 rpm.
Western Digital grants a warranty period of three years starting from
the date of purchase.
{jphoto image=46211}
Western Digital WD10JFCX has positioned itself stubbornly at the top,
both in synthetic benchmarks as well as in the more
application-oriented PCMark suites. This good performance is very
commendable in view of the rather low power consumption and moderate
noise level. Heat creation however is a little higher than most. Given
the focus of WD's Red series for a NAS environment, we can certify
unrestricted applicability of the WD10JFCX for such a scenario. The
extended warranty period of three years provides the purchaser with a
further argument regarding drive reliability.
Other Settings and Notes
Unless stated otherwise, all drives will be tested on a SATA 6 Gb/s
port on the P67 chipset, with the results of each benchmark smoothed
over several runs in order to get an average value. This way, single
variations to not affect the overall result.
We measured power consumption of the hard drives via an external
power meter in combination with a USB docking station. The docking
station behaves in a neutral way without inserted HDD and has no
consumption. Any applicable "operating overhead" is therefore identical
for all drives. The measured values are not representative for each
operating scenario, but only show the measured consumption. The
measurement is only there to provide a relative consumption hierarchy of
the drives.
The measurement of the noise levels of the individual hard drives was
also carried out using the USB docking station. The sound level meter
"3222 Data Logger" by Voltcraft was placed at 10 cm distance, we
measured both the sound pressure during a sequential write access, as
well as in Active Idle state. Analogous to measuring power, please
remember that this is a relative assessment of noise level.
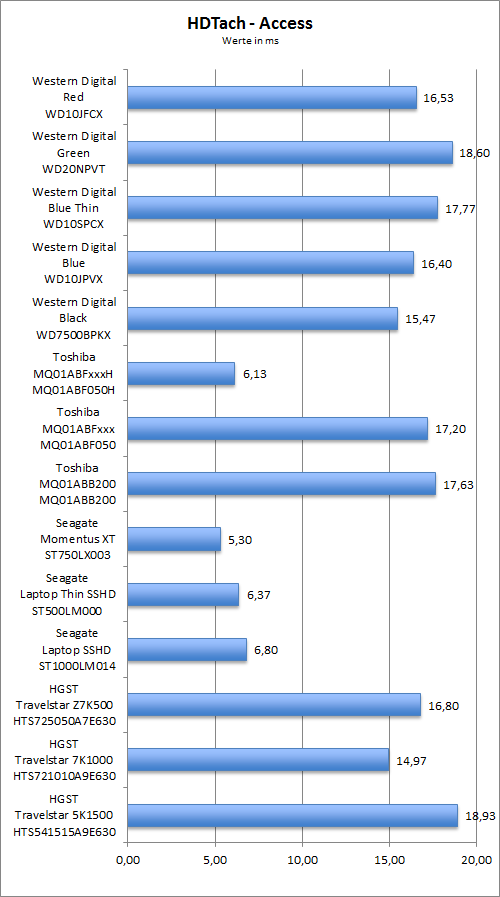
The measured Random Access Time under HDTach was clearly won by the
hybrid SSHDs by Seagate and Toshiba. Only in the first run they showed
values raning from 15-18 ms. In all subsequent runs, the access time
immediately fell to 0.3 ms. Among normal HDDs, the HGSTs Travelstar
7K1000 achieved nearly 15 ms, placing it at the top. The last position
goes to the 5K1500.
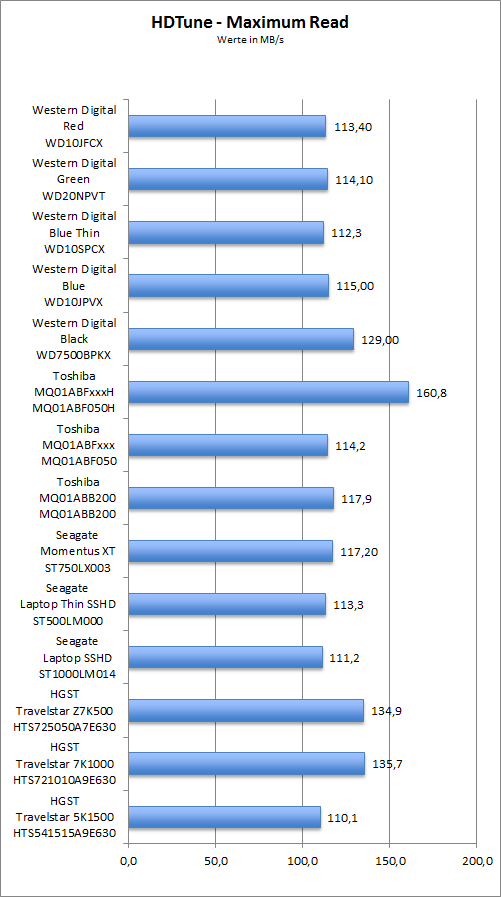
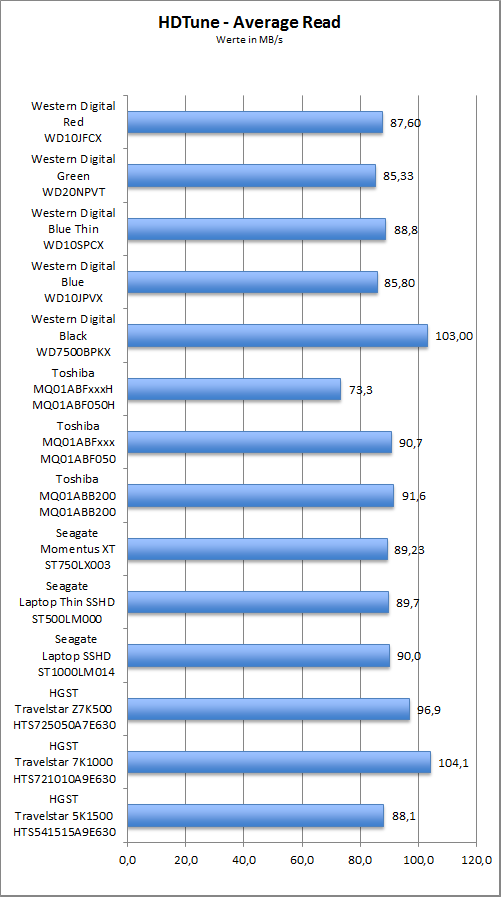
Using HDTune we determined the read and write transfer rate throughput:
In the HDTune 5.5 read benchmarks, the Travel Star 7K1000/Z7K500 and
WD7500BPKX were able to set themselves apart from the competition. The
three benefit from their high rotation speed and the cache, which the
competition lacks. Due to the lack of learnable patterns and available
flash capacity, the SSHDs were beaten, and are entirely dependent on the
performance of their HDD part. And since they rotate at a speed of 5400
rpm, they were not able to prevail in this test.
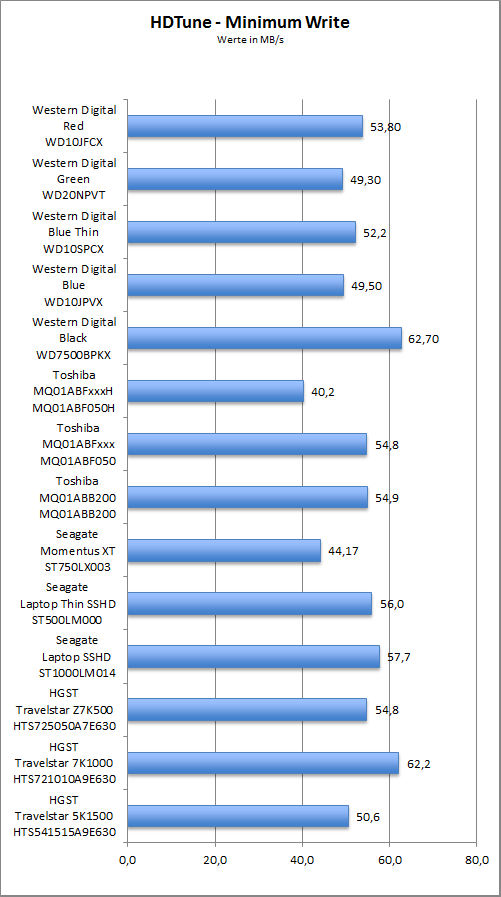
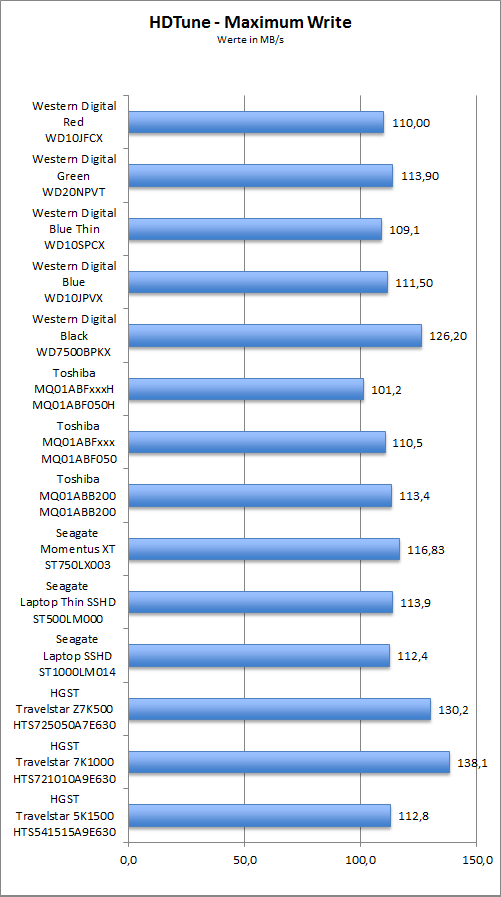
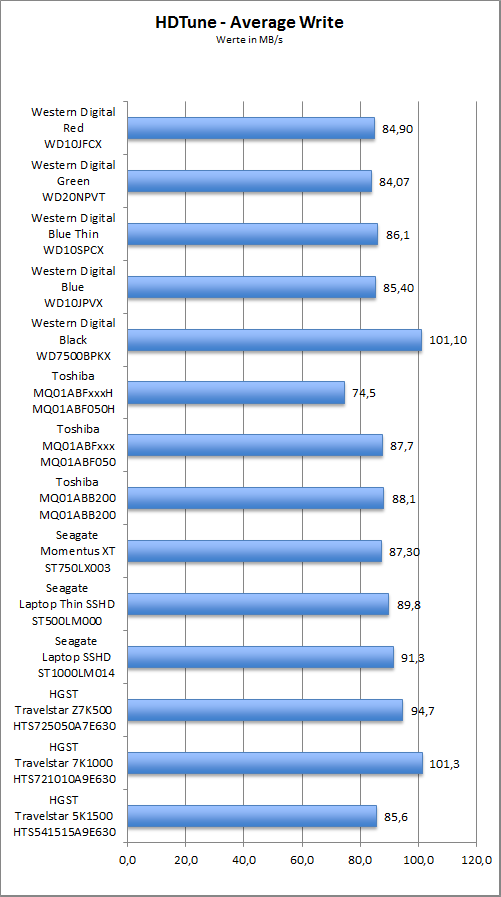
After the reading results, we now look at the results when writing:
The write benchmarks show a similar picture as in the reading
benchmark. The three 7200-rpm drives from Western Digital and HGST are
at the top, followed by the remaining participants.
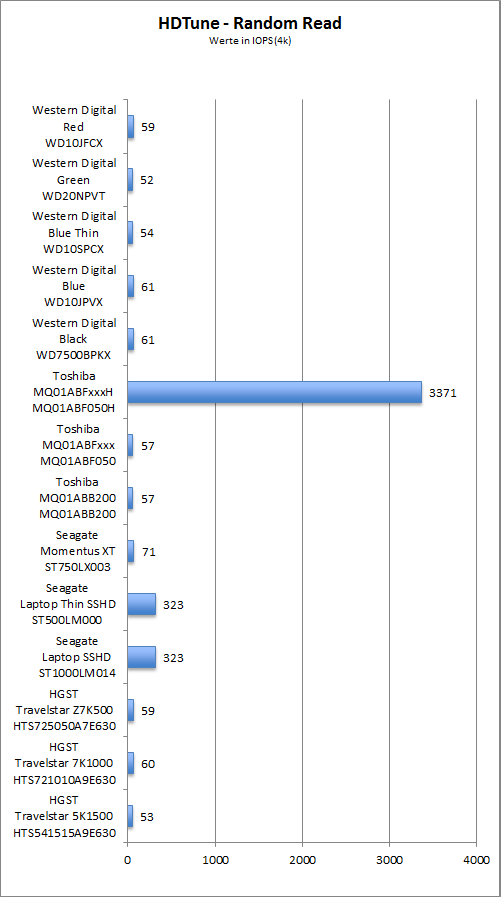
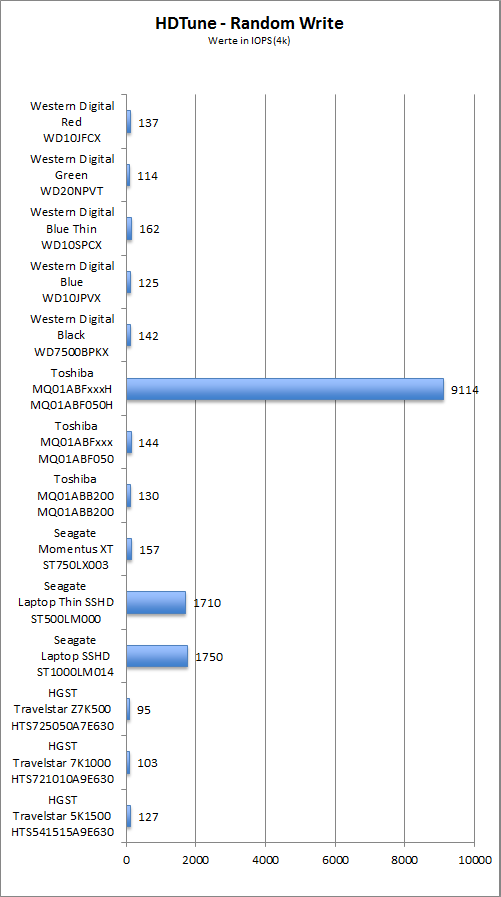
The random read test in HDTune provides a rough calculation of how
many operations can be completed when reading and writing
simultaneously. Of course, the results can not compete with SSDs, which
achieved over 30,000 IOPS.
Interestingly, the evaluation of the IOPS results shows the
differences between the learning algorithms and the controllers of
modern SSHD drives. All three Seagate drives are more than clearly
beaten by the Toshiba MQ01ABF050H. In a direct comparison between the
Momentus XT and laptop SSHDs you can see that Seagate was able to
increase the quality of recognition algorithms by a factor of almost 5
to 10. The remaining HDDs stagnate at the usual ranges from 50-60 IOPS
(read) and 120-160 (write).
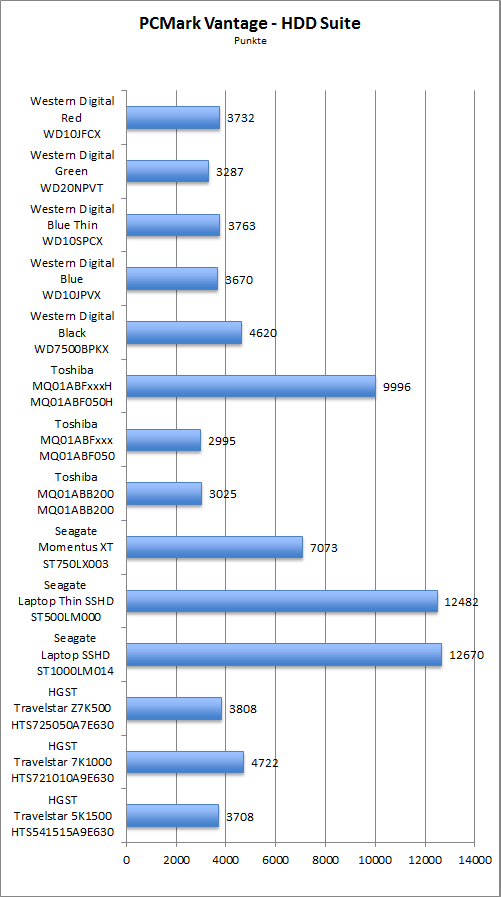
PCMark Vantage consists essentially of two parts: the actual speed of
the system is determined by performing "real" actions such as image and
text editing, video playback and much more. It is often difficult or
even impossible to tell the difference between different drives, because
these types of benchmarks is often thwarted by the rest of the system
(CPU, RAM, graphics card). The HDD test of PCMark however is more
synthetic in nature since only so-called Traces are being played back
(recorded requests when working with different programs). Assuming the
rest of the system would not limit an SSD, the performance of a system
would correlate with the results of the HDD tests - if the same or at
least similar programs are being used as in the original recording of
traces.
Unfortunately, the results of the gaming and music benchmarks have a
relatively high fluctuation. In both tests, a clear statement is
therefore only possible when there is at least 10% difference in
results. The results of the other tests are much more reproducible (mean
error rate no higher than 3%).
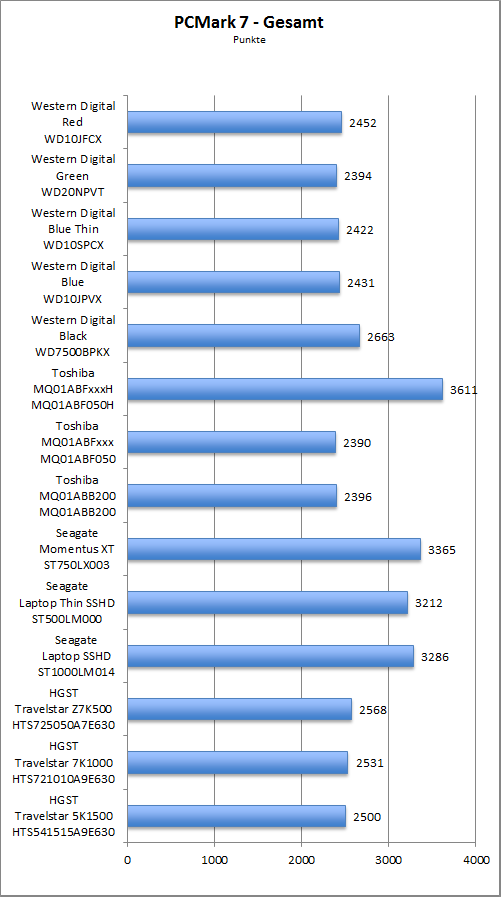
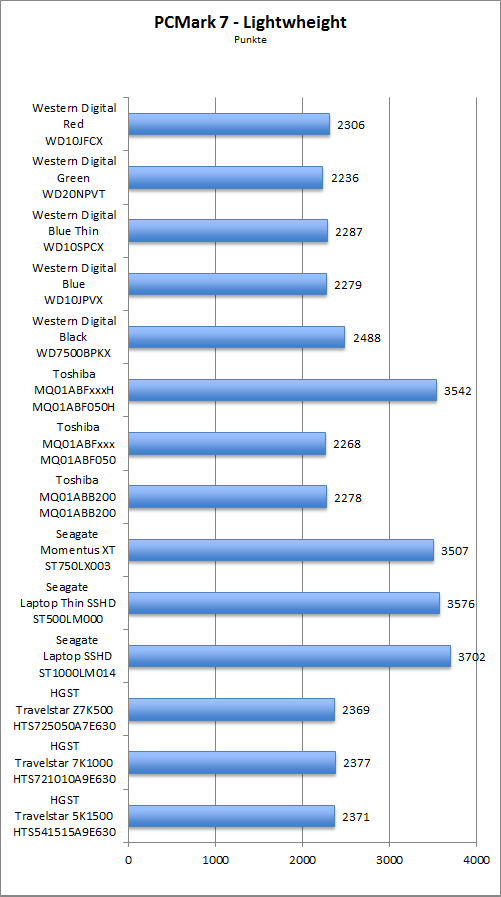
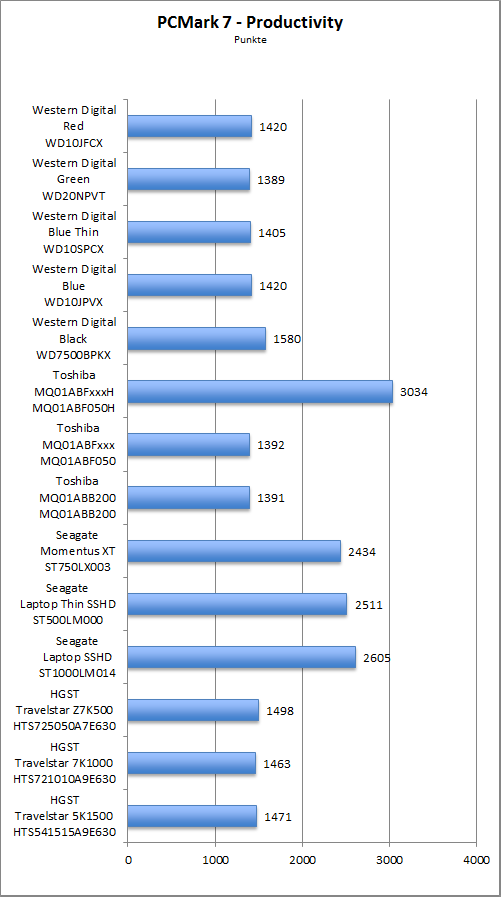
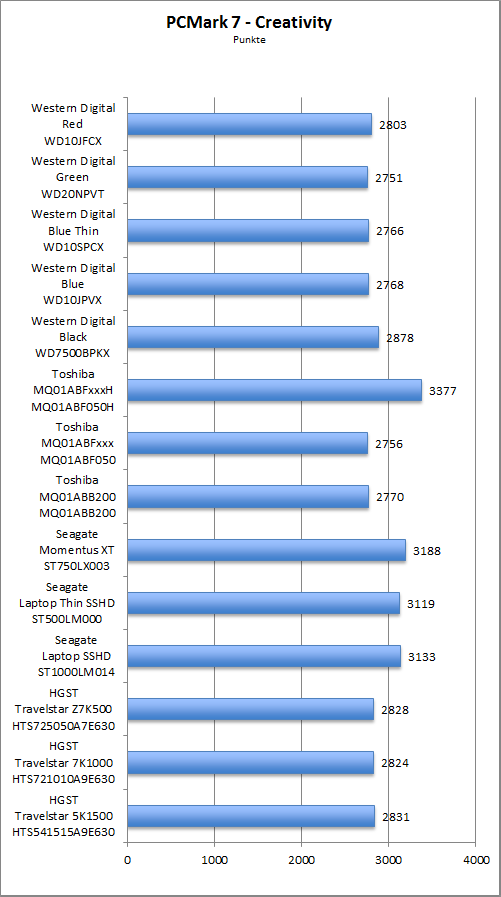
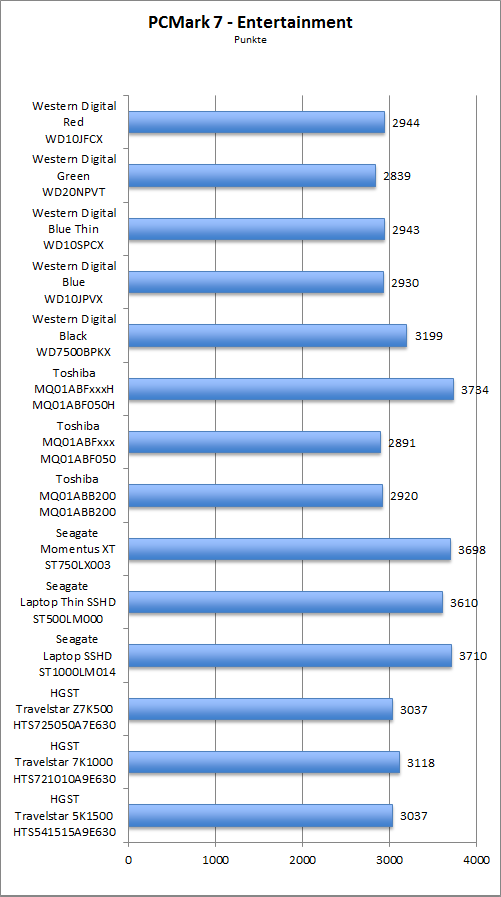
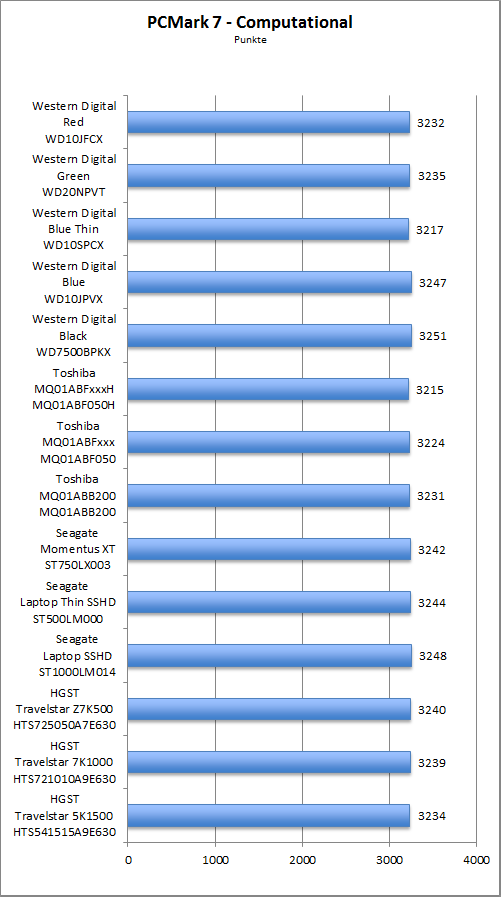
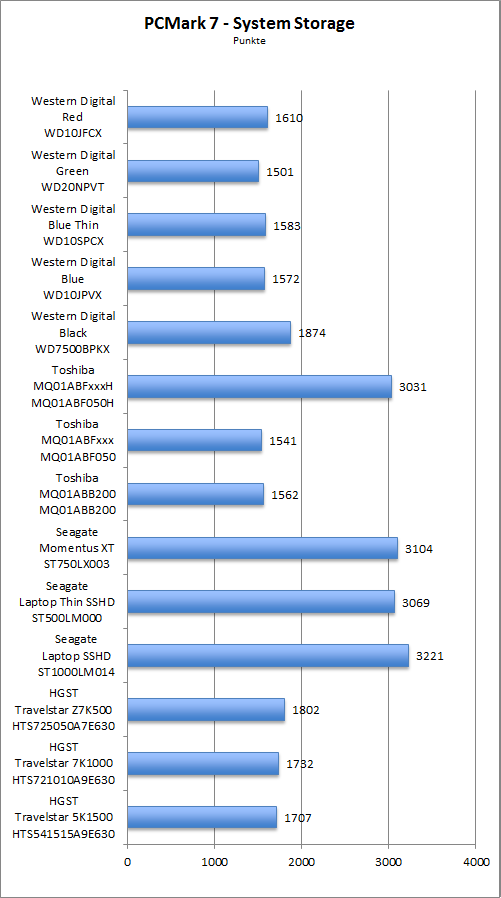
PCMark 7 is the direct successor to the older Vantage version, and as
the name suggests it is optimized for use with Windows 7. The single
benchmarks were divided into different categories; all tests (except for
the storage benchmark) again are meant to determine the real
performance of the system by including - in addition to the SSD (or the
HDD) - all other components of the system (CPU, memory, graphics card)
into the tests. Anyone interested in a more detailed description can
refer to the comprehensive PCMark 7 Whitepaper (PDF).
Fortunately, reproducibility of results compared to the previous
version has increased enormously: the resulting scores' variation
between passes is almost always less than 0.5 percent. This makes it
easier to identify performance differences between SSDs, without
measurement fluctuations interfering in the comparison.
In both PCMark benchmark suites, the new SSHDs drives from Seagate
and Toshiba were able to show their full potential. Without exception,
the four drives were able to set themselves apart from the competition,
and then some. Due to PCMark Vantage being slightly dated, differences
to the rest of participants are of course much higher. However, these
benchmarks still show the enormous potential of the learning algorithms
when dealing with "learnable" tasks. They are no cure-all, but provide a
good compromise between "expensive" SSDs and "slow" HDDs. Especially
when it comes to flash equipment of modern HDDs we still see room for
improvement, even though SSHDs will never outrun the "real" SSDs in raw
performance.
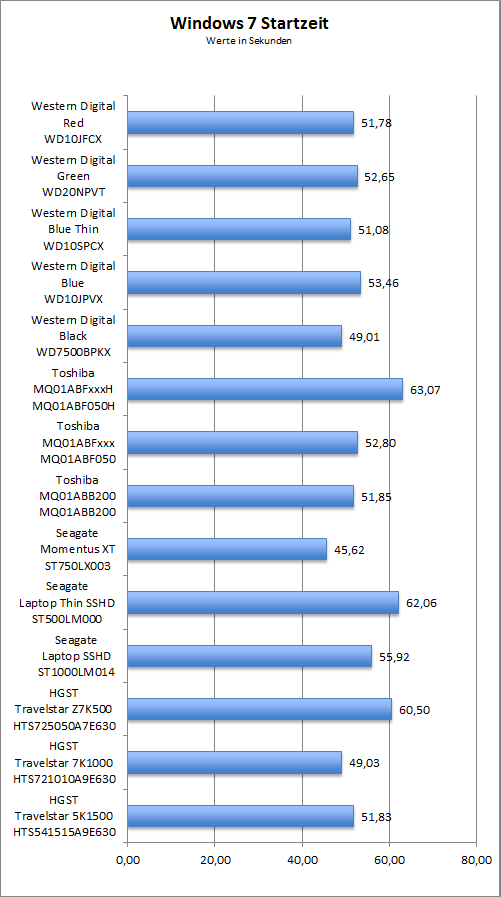
To obtain information about the suitability of the disks as a
potential system drive, we cloned the original Windows 7 test system to
the tested drives, then restarting the system several times in a row. We
measured the time from turning on the PC up to the moment the login
screen of Windows 7 was displayed; accordingly, the entire boot-up
process of the BIOS is included in the measurements:
As expected, the three drives with high rotational speed provided for
the fastest boot-up behavior. The Momentus XT was way on top, though
the Adaptive Memory algorithms are likely to have contributed their part
in it. The performance of the other SSHDs drives from Seagate and
Toshiba was far from good in this test. With almost 63 seconds, the
MQ01ABF050H even set a new negative record.
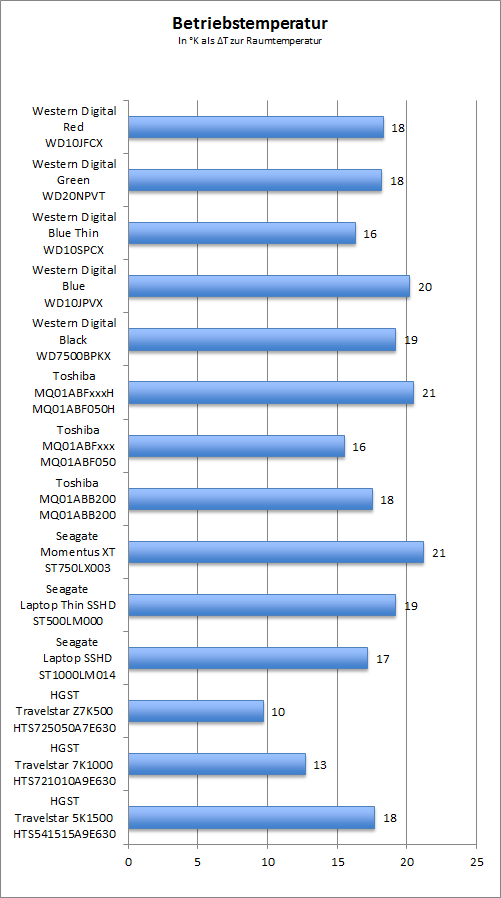
In order to determine the maximum operating temperature of the hard
drives under load, each drive has been completely overwritten after
completion of the respective benchmarks using the Erase function of
HDTune. This allowed us to make sure that the drives are exposed to a
constant high load and release a great deal of heat because of permanent
write operations. The temperatures of the disks was recorded by reading
the corresponding SMART value immediately after the erase operation,
and adjusted to the ambient temperature at the time of measurement in
order to ensure comparability.
The measurements for heat generation in high load writing operations
put the two Momentus XT, MQ01ABF050H and WD10JPVX at the (negative) top,
whereas the Travelstar 7K1000 and Z7K500 did quite well, just as
Toshiba's MQ01ABF050 and the WD10SPCX from Western Digital.
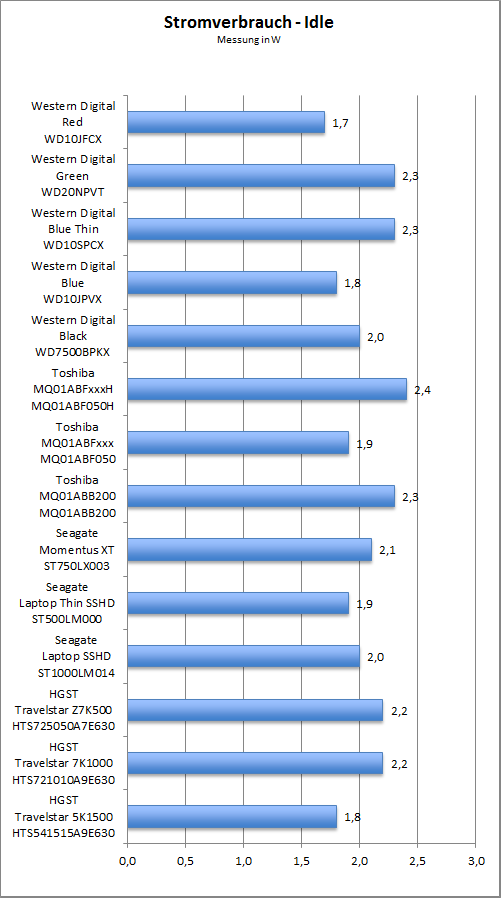
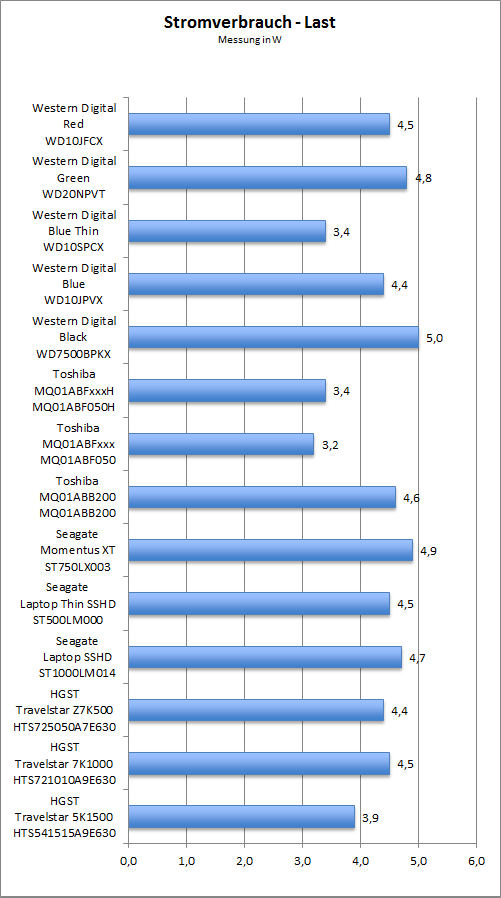
We have also taken a look at the power consumption of hard drives, in standby mode (idle) and under load:
As expected, at the top of the power consumption scale we find the
WD7500BPKX by WD, since its performance has to be payed up with an
appropriate ammount of energy. Due to its four-disk design, the
WD20NPVT's consumption is also quite high, both when idle as well as
under load. Then again, Toshiba's MQ01ABF050 was quite frugal.
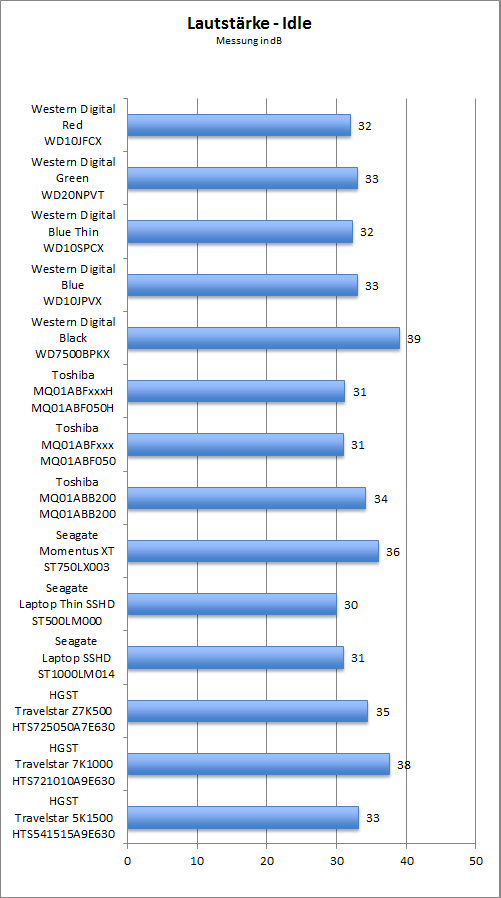
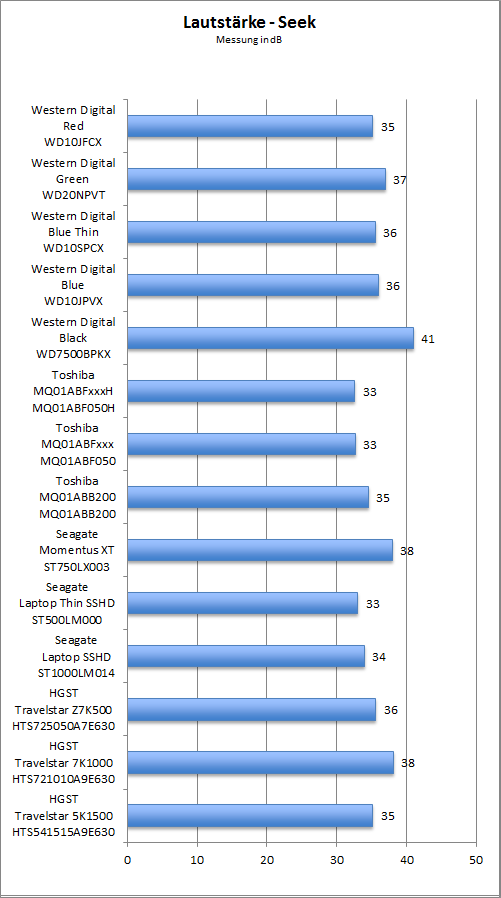
We also compared the development of the operating noise, in standby mode (idle) and during the seek phase of accesses:
Needless to say, the drives rotating at 7200 rpm are particularly
loud: HGST's Travelstar 7K100, Seagate's Momentus XT and Western
Digital's Black are at the top of this test. The two SSHD series from
Seagate and Toshiba turned out to be quite sneaky. These three drives
show the lowest overall values in this category.
Of the tested 14 hard disks with
different technical data, it will of course prove difficult to provide
an overall 'winner', since the requirements of the respective
application areas are much too varied. Some people mainly want
a drive that operates quietly. Others require brute power, in which
case the price won't play such a big role. Our final evaluation will
therefore focus exclusively on the areas of "performance" and "value for
money". In addition, we recommend an "all-round" drive.
If you care for performance and fast data access, or if you want to
use the drives for performance-oriented purposes, we recommend first and
foremost one of the shown hybrid drives (Seagate SSHD or laptop Toshiba
MQ01AFxxxH). The drive by Seagate is a bit better than Toshiba's
bolide. If you only want to rely on the tried and true disk technology
without flash, we recommend either the Western Digital Black
(WD7500BPKX) or the Travelstar 7K1000 of HGST. These models offer a
first-class performance and can be easily installed in laptops or
external data cases. Price, power consumption and heat generation are of
course somewhat higher.
In the category with a good price-performance ratio we have three
drives (based on their ct/GiB ratio). Specifically, HGST's 5K1500,
Toshiba's MQ01ABB200 and Western Digital's WD10JPVX. All three drives
cost an affordable 7 cents per usable GB. The low price is indeed due to
the slightly lower performance, but when used as data dump, this is not
really an issue. We chose Toshiba's MQ01ABB200 because it provides the
buyer with the most total usable storage space at nevertheless
acceptable transfer rates.
For everyday use without excessive performance ambitions, the
Travelstar 5K1500 by HGST is a very good all-round drive. This is a very
solid drive, placed in midfield in all benchmarks and
consumption/heat/noise measurements. With a capacity of 1.5 TB, it also
offers plenty of space for application data or multimedia files. The
HTS541515A9E630 is not overly expensive, and is also part of our
value-for-money recommendations.


 - Boxed")
 - Unboxing")
 - Contents")
 - Angled")
 - Front")
 - Back")
 - HyperX Top")
 - HyperX")
 - Installed")


 If
you are in the process of deciding for a particular notebook HDD you
will have noticed that the variety of models is in the way of making a
quick selection. Criteria like amount of storage space, speed of data
transfer, purchase price or the height of the HDD are joined by the
feature of hybrid (sshd) drives. To get a good overview of the current
market situation, we compared a total of 14 2.5" test
subjects in different variants. Among them are various models of the big
four manufacturers (HGST, Seagate, Toshiba and Western Digital). The
storage space ranges from 500 gigabytes to 2 terabytes, with HDDs' and
SSHDs' heights varying from slim 7 to massive 15 mm. The following pages
will feature technical details and of course a performance check.
If
you are in the process of deciding for a particular notebook HDD you
will have noticed that the variety of models is in the way of making a
quick selection. Criteria like amount of storage space, speed of data
transfer, purchase price or the height of the HDD are joined by the
feature of hybrid (sshd) drives. To get a good overview of the current
market situation, we compared a total of 14 2.5" test
subjects in different variants. Among them are various models of the big
four manufacturers (HGST, Seagate, Toshiba and Western Digital). The
storage space ranges from 500 gigabytes to 2 terabytes, with HDDs' and
SSHDs' heights varying from slim 7 to massive 15 mm. The following pages
will feature technical details and of course a performance check.

